In Portfolio Construction: Part 1 – Combining Assets, we looked at a variety of ways in which groups of assets can be bundled together. We also looked at some of the major characteristics of these assets, and showed where they differ. In Where Should I Invest? we concluded that although stocks may offer the best reward over the long term, they are also extremely risky. To overcome this problem investors combine assets in a portfolio to maximize returns and reduce risk… lets look at how this works in reality.
Below you can see the result of investing £1000 in the Microsoft (MSFT) at the beginning of 2007. Two things are clear (1) you would have made a lot of money (£2724 of profit), (2) the returns were reasonably bumpy. As an investor you want to maximize the ratio of risk to return i.e. for each unit of risk, you want the highest possible return. This is measured by a simple calculation called the Sharpe Ratio = (Portfolio Return – Risk Free Rate) / Portfolio Risk . The Sharpe Ratio of Microsoft over this time period was 0.46.
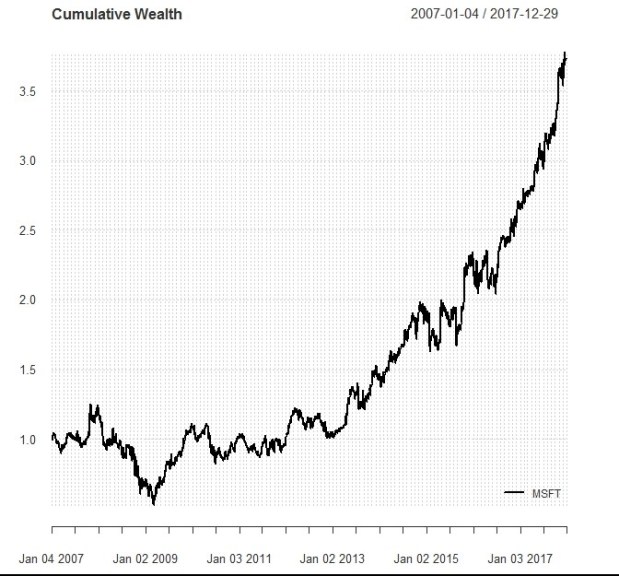
Cumulative Wealth Affect of Investing in Microsoft
Now lets look at an investment of £1000 into Ford (a less exciting business), also in the year 2007. In contrast to Microsoft the return on your initial investment would have been meaningfully lower (£1058 of profit), in addition, the risk is higher as you can see by the more volatile movements of the red line (F = Ford). This is reflected in the lower Sharpe Ratio of 0.15.
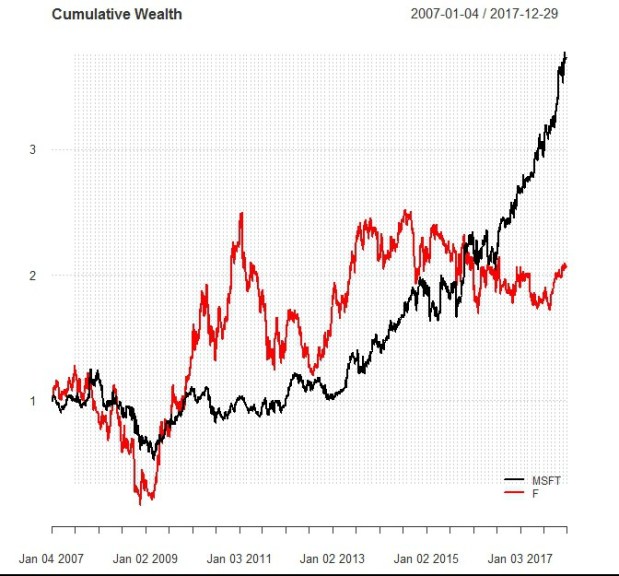
Cumulative Wealth Affect of Investing in Microsoft & Ford
Looking at these two Sharpe Ratios (Microsoft = 0.46, Ford = 0.15) the obvious conclusion would be that the best possible choice would be to just invest in Microsoft and ignore Ford altogether… a better return and lower risk are the exact characteristics an investor should be looking for. This is true. If you had to pick between one or the other, than £1000 in Microsoft would be a better decision, but why not invest in both! A blended portfolio with both Microsoft and Ford would look like this…
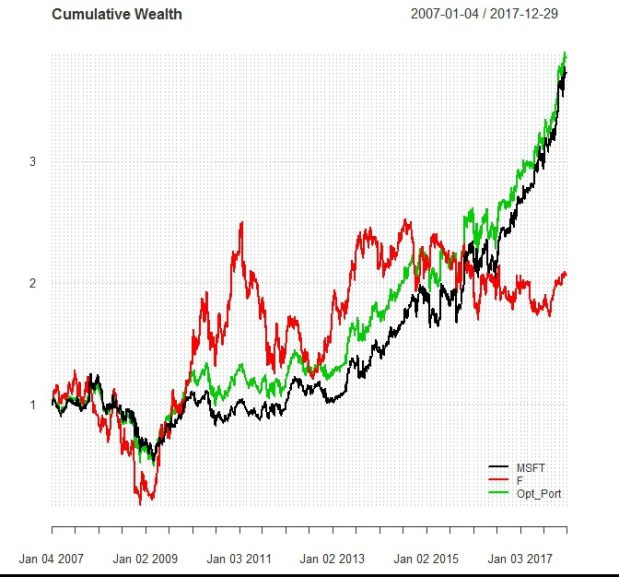
Cumulative Wealth Affect of an Optimized Portfolio
Looking at the optimized portfolio (the green line) we can see that by combining the two stocks into a portfolio the return is similar to that of Microsoft – in fact its a little higher (£2852 profit)! Whilst the volatility has also reduced when compared to Microsoft, you can see this by looking at how the green line moves between 2010-2013. As you would have guessed, this means the optimized portfolio has a higher Sharpe Ratio, 0.49!!
What is the point of all this? This example is set out to clearly demonstrate the benefit of portfolio diversification. By combining a number of different assets an investor can not only achieve a higher level of return, they can also do this by taking less risk. In Part 3, I will explain more about how and why this happens.
