Portfolio Construction

Portfolio Construction: Part 3 – Correlation

So far in this ‘Portfolio Construction’ series we have introduced the idea of a portfolio, summarised how different assets classes behave and concluded that we are likely all owners of a multi-asset portfolio (Part 1). We then moved on to show how combining assets is beneficial to an investor by both increasing returns and reduce risk (Part 2). In this post we will talk through the underlying mechanics of how combining assets has a positive impact… correlation.

Lets start with some definitions and simple examples: Correlation – a relationship or connection between two or more things. Examples: sunny weather and ice cream sales, time slept and energy throughout the day. These examples both show positive correlation i.e. they both rise together. A negative correlation, when one thing goes up, the other goes down, is still a relationship and can be very strong one i.e. smoking and lung capacity, exercise and body fat (although some might not agree this has a strong correlation!). Finally, we also have a low/no correlation, mobile phone sales and rainfall… they will have no impact on one another. Correlations are measured mathematically on a scale of -1 to 1, 1 meaning a strong positive correlation, -1 a strong negative and 0 representing no correlation. You can see graphical examples of these below.

Illustrative Correlations with Trendline

Lets link all of this back to investing. When thinking about a portfolio, correlations are important because a portfolio of highly correlated assets would all do well together, or do poorly together. Most investors would rather have a smooth journey i.e. a portfolio that slowly climbs over time, than something that swings between making and losing you lots of money. 

Imagine you had all your savings in Marriott and Hilton, two luxury hotel companies, your portfolio would have performed like the below…

Marriott and Hilton

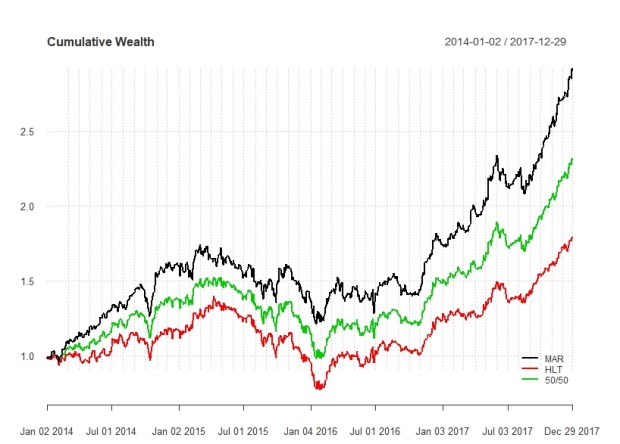
Cumulative performance of Marriott, Hilton and a 50/50 portfolio

You can see from the chart that the pattern between the two companies returns is almost identical, when one of these stocks performs well, so does the other, when one performs badly so does the other. Combining these two stocks, offers little difference in the observable pattern. Contrast this to the example we looked at in Building a Portfolio which you can see again below.

Opt Port

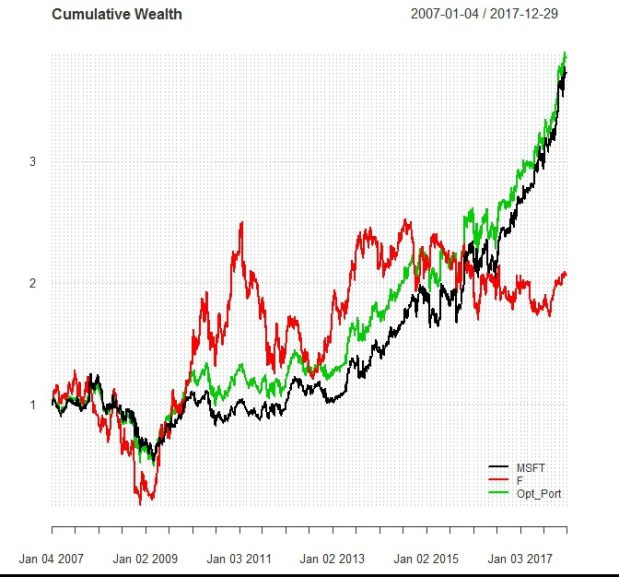
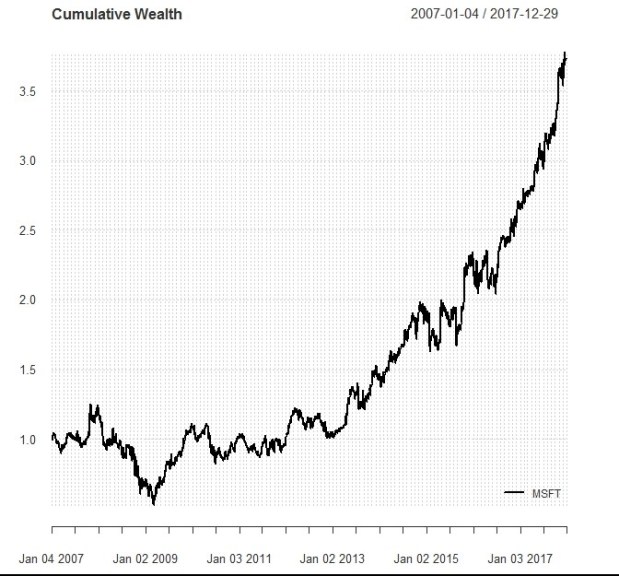
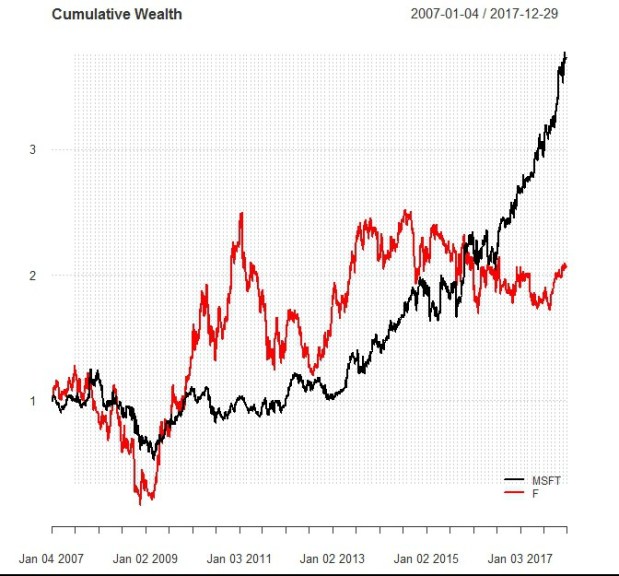
Cumulative performance of Microsoft, Ford and an Optimized Portfolio of both

As you can see, it is clear that the relationship between Marriott and Hilton is much closer than the relationship between Microsoft and Ford. This is reflected in the correlation numbers which are 0.73 and 0.4 for each pair, respectively.

By combining two things which are highly correlated you create a portfolio which is highly correlated to the original two things – the benefit of doing this is minimal. You can see by looking at the first chart you are better off having invested in just Marriott than buying Hilton or both. This is in contrast to Microsoft and Ford, where the combination was something different, and actually performed better than both the individual stocks. This was evidenced in the Sharpe Ratio which was 0.46 for Microsoft, 0.15 for Ford, and 0.49 for the combination. Marriott and Hilton have a Sharpe Ratio of 1.41 and 0.68 respectively. However when combining the two the Sharpe Ratio falls to 1.12 – lower than just holding Marriott.

OK… so why is this important to consider? When constructing a portfolio it is important for investors to consider their portfolio as a whole, and not each investment in isolation. If your best ideas happen to be 5 energy stocks… they might be great ideas on their own, and they might do very well for you… until the oil price crashes and they all come tumbling down at once. By looking at the correlation between the assets within a portfolio, investors can better avoid unknowingly putting all their eggs in one basket!

Portfolio Construction: Part 2 – Building a Portfolio

In Portfolio Construction: Part 1 – Combining Assets, we looked at a variety of ways in which groups of assets can be bundled together. We also looked at some of the major characteristics of these assets, and showed where they differ. In Where Should I Invest? we concluded that although stocks may offer the best reward over the long term, they are also extremely risky. To overcome this problem investors combine assets in a portfolio to maximize returns and reduce risk… lets look at how this works in reality.

Below you can see the result of investing £1000 in the Microsoft (MSFT) at the beginning of 2007. Two things are clear (1) you would have made a lot of money (£2724 of profit), (2) the returns were reasonably bumpy. As an investor you want to maximize the ratio of risk to return i.e. for each unit of risk, you want the highest possible return. This is measured by a simple calculation called the Sharpe Ratio = (Portfolio Return – Risk Free Rate) / Portfolio Risk . The Sharpe Ratio of Microsoft over this time period was 0.46.

msft1.jpeg

Cumulative Wealth Affect of Investing in Microsoft

Now lets look at an investment of £1000 into Ford (a less exciting business), also in the year 2007. In contrast to Microsoft the return on your initial investment would have been meaningfully lower (£1058 of profit), in addition, the risk is higher as you can see by the more volatile movements of the red line (F = Ford). This is reflected in the lower Sharpe Ratio of 0.15.

msft-ford.jpeg

Cumulative Wealth Affect of Investing in Microsoft & Ford

Looking at these two Sharpe Ratios (Microsoft = 0.46, Ford = 0.15) the obvious conclusion would be that the best possible choice would be to just invest in Microsoft and ignore Ford altogether… a better return and lower risk are the exact characteristics an investor should be looking for. This is true. If you had to pick between one or the other, than £1000 in Microsoft would be a better decision, but why not invest in both! A blended portfolio with both Microsoft and Ford would look like this…

Opt Port

Cumulative Wealth Affect of an Optimized Portfolio

Looking at the optimized portfolio (the green line) we can see that by combining the two stocks into a portfolio the return is similar to that of Microsoft – in fact its a little higher (£2852 profit)! Whilst the volatility has also reduced when compared to Microsoft, you can see this by looking at how the green line moves between 2010-2013. As you would have guessed, this means the optimized portfolio has a higher Sharpe Ratio, 0.49!!

What is the point of all this? This example is set out to clearly demonstrate the benefit of portfolio diversification. By combining a number of different assets an investor can not only achieve a higher level of return, they can also do this by taking less risk. In Part 3, I will explain more about how and why this happens.

Portfolio Construction: Part 1 – Combining Assets

As mentioned in ‘Where Should I Invest?‘ a portfolio is simply a combination of assets. This can be a combination of the same type of asset i.e. 5 stocks, or a multi-asset portfolio i.e. 3 stocks, 2 bonds, and 1 property. These assets can be weighted/combined in a number of ways (see below).

An illustration of an equally weighted stock portfolio and unequally weighted multi-asset portfolio.

Equal weight is an easy to understand method where each asset is held in proportion to the others. More complex weighting methods exist, such as market-cap weighted (FTSE 100), price weighted (Dow Jones). However, the most interesting weighting schemes involve optimisation i.e. building a risk-adjusted portfolio (we will cover this in Portfolio Construction: Part 2).

As a Joe Public investor, you are likely to have an unequal weight, multi-asset portfolio. Your savings are often in cash (hopefully not…’Participation is Key’.), your pension is typically a combination of equities and bonds and you are likely have invested in residential property via a mortgage. As a result, it is extremely beneficial to understand the characteristics of a multi-asset portfolio… after all, you have one!

You need not worry… there are good reasons as to why investors construct multi-asset portfolios. In ‘Where Should I Invest?’ we compared only the risk/return relationship between major asset classes – there are a number of other elements investors may be interested in controlling. By combing assets to their individual needs every investor is able to limit their exposure to undesirable characteristics. The most popular attributes are summarised below;

Table summarising key characteristics of major asset classes.

Just as an example… the Average Joe holds cash because it allows them to be ‘liquid’ (have physical money i.e. spending money, on demand), have a company pension plan which is loaded up with equities (because they hope for long term capital growth) and if they are lucky enough they let residential property as they expect to benefit from the monthly income and long term price appreciation. As you can see from the chart above, these three assets all behave quite differently and as a result they create a very popular and effective portfolio.